2022 Growth Benchmarks for Private SaaS Companies
[ad_1]
It’s not difficult to benchmark your SaaS company’s performance against that of public SaaS companies, but it’s also of limited usefulness. The sheer scale of public companies makes for an apples-to-oranges comparison to smaller, private companies that may prove misleading or distracting. To solve for this information gap, we started conducting our annual survey a decade ago to help small, private companies better understand how their performance compares to that of their peers.1 The most important metric we track in the survey is revenue growth. This is because your company’s growth rate is the single largest determinant of your valuation multiple, and how you compare with companies of similar size and stage determines whether you might see a valuation premium (or discount) to the median valuation of your peers.
Private SaaS Growth Rates by Company Size
A comparison of how fast your SaaS business is growing versus others’ growth rate is only relevant when you are comparing similarly sized businesses. A growth rate of 30% for a $5 million SaaS business is below the median, while growth of 30% for a $20 million SaaS business is above the median. Despite identical growth rates, the smaller company might be worth 5 times revenue (as a relative laggard), while the larger might be worth closer to 10 times revenue (as a champion among its peers).
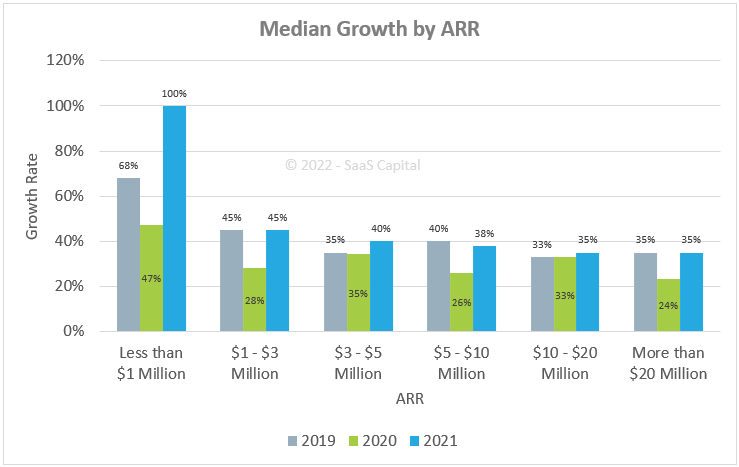
The chart below shows median year-over-year (YoY) growth broken down by Annual Recurring Revenue (ARR) for 2019, 2020, and 2021.

We were pleased to see 2021 growth rates return to pre-pandemic levels. We had heard from many portfolio companies and prospective borrowers that new sales were essentially zero in Q2 2020 as customers focused internally, retooling to work-from-home, or altering operations to keep employees safe. In Q3 2020, sales returned somewhat, but sales cycles were lengthened significantly as software buyers remained hesitant, not knowing how long the pandemic would last. By Q4, most companies had stabilized and resumed business-as-new-normal into 2021.
The overall median growth rate for all companies in the survey registered 40%. This is up from an overall median of just under 30% in 2020 and puts growth at the same pre-pandemic levels seen in 2019. Median growth rates at each company size category are higher than 2020 and, for the most part, match or exceed 2019 levels. Further, fewer companies shrank in 2021 than in 2020. Overall, only 2.7% of the companies reported flat or negative growth in 2021, compared to 13% in 2020.
Private SaaS Growth Rates by Funding Type
The chart above shows the median growth rates for equity-backed and bootstrapped companies in 2021 versus 2020, broken down by ARR.
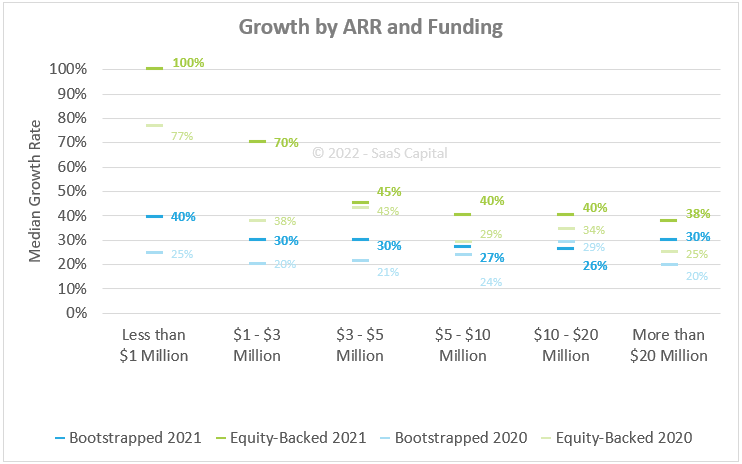
Historically, we have seen that equity-backed companies report higher growth rates than bootstrapped companies. And while it’s not clear which is the cause and which is the result since investors look to back companies that already show signs of being high performers, understanding the difference is important for benchmarking.
In 2021, equity-backed companies with $1M to $3M in ARR reported median growth of 70%, which is nearly twice what was reported in 2020, and nearly twice what bootstrapped companies showed in 2021.
At each company size category, equity-backed companies reported higher median growth rates than bootstrapped companies. But, it’s worth pointing out that they are paying for this growth – literally — with the cash they raised from selling their equity to VCs: equity-backed companies reported spending approximately 44% more on marketing and 100% more on sales than did bootstrapped companies. (See 2022 Spending Benchmarks for Private B2B SaaS Companies.)
Furthermore, total median spend levels across all departments showed equity-backed companies were operating at a loss while bootstrapped companies were operating at a profit.
The venture capital gamble is that selling some of your equity for cash for you to spend on growth will allow you to achieve a certain ARR level and growth rate faster than a bootstrapped version of yourself. SaaS valuations are calculated as multiples of ARR, and the single biggest driver of the multiple is the growth rate.
So, a higher growth rate should result in a higher valuation multiple, sooner in the company’s timeline than you would have otherwise achieved by staying bootstrapped. In raising venture, you hope this increased valuation multiple more than offsets the dilutive percentage sold off to investors (AKA, a smaller slice of a bigger pie).
Through our decade-plus of lending to SaaS companies, we have empirically seen that raising venture capital does not change growth rates in a meaningful way. It is far more likely that the VC-backed companies in the survey were already growing quickly before they raised outside capital. This is important to understand as you contemplate the “VC gamble.” Now, venture capital can have real, positive impacts like an accelerated product roadmap, external validation and network effects, and a war chest for acquisitions. But it is important to be honest about how hard it is to bend the growth curve.
Acknowledging our bias as a lender, we consider the engine (the company’s business model and product-market fit) as far more important than the type of fuel (the capital). Pouring VC “rocket fuel” into a rocket may work fine – but it won’t transform a Ferrari (or a Honda) into a spaceship.
Other Takeaways on Private SaaS Growth
The full Research Brief offers additional commentary on the data above as well as breakdowns on growth rate by funding type, growth rate and retention, and growth rate by company age. Key takeaways include:
- Overall, bootstrapped companies reported growing at a median of 30% in 2021 versus 22% in 2020, whereas companies that have raised venture capital financing were growing at a median of 45% in 2021 versus 33% in 2020. Our thought is that bootstrapped companies are more stable and consistent regardless of the macroeconomic environment, whereas equity-backed companies are by their nature more operationally levered, which will provide a higher variance in results, to both the upside and downside.
- Growth rate is positively and exponentially correlated with net revenue retention. Increasing Net Revenue Retention (NRR) from 100% to 110% improves growth rate by 5%, increasing NRR from 110% to 120% improves growth by 7%, increasing NRR by another 10% improves growth by 13% and another 10+% improves growth by an amazing 30%.
- Continuing a pattern we have observed over the years, average annual contract value (ACV) does not appear to have a significant impact on growth rate. We have seen in a previous analysis, however, that increasing ACVs over time is an important component of scaling a SaaS company. This relates back to the bullet above on higher net retention rates driving significantly higher growth rates.
- SaaS companies targeting a horizontal market are growing faster than companies attacking a vertical industry: 45% growth versus 38%, respectively.
- Interestingly, this year’s survey revealed that billing frequency had no impact on median growth rates. Previous surveys had shown that companies billing annually upfront reported higher growth than those billing month-to-month. However, it is still worth noting that annual billing companies enjoy a meaningful cash flow advantage over monthly billers.
To download the full analysis, please see – 2022 Private SaaS Company Growth Rate Benchmarks.
1In Q1 of each year, SaaS Capital conducts a survey of B2B SaaS company metrics. This year marked our 11th annual survey, and it continues to grow with more than 1,500 private B2B SaaS companies responding, making it the largest survey of its kind. Below are our findings on growth.
[ad_2]
Source link