Introducing Discovery Ad Performance Analysis

[ad_1]
1. Generic image features
a. These features apply to all images and include the color profile, whether any logos were detected, how many human faces are included, etc.
b. The face-related features also include some advanced aspects: we look for prominent smiling faces looking directly at the camera, we differentiate between individuals vs. small groups vs. crowds, etc.
2. Object-based features
a. These features are based on the list of objects and labels detected in all the images in the dataset, which can often be a massive list including generic objects like “Person” and specific ones like particular dog breeds.
b. The biggest challenge here is dimensionality: we have to cluster together related objects into logical themes like natural vs. urban imagery.
c. We currently have a hybrid approach to this problem: we use unsupervised clustering approaches to create an initial clustering, but we manually revise it as we inspect sample images. The process is:
- Extract object and label names (e.g. Person, Chair, Beach, Table) from the Vision API output and filter out the most uncommon objects
- Convert these names to 50-dimensional semantic vectors using a Word2Vec model trained on the Google News corpus
- Using PCA, extract the top 5 principal components from the semantic vectors. This step takes advantage of the fact that each Word2Vec neuron encodes a set of commonly adjacent words, and different sets represent different axes of similarity and should be weighted differently
- Use an unsupervised clustering algorithm, namely either k-means or DBSCAN, to find semantically similar clusters of words
- We are also exploring augmenting this approach with a combined distance metric:
d(w1, w2) = a * (semantic distance) + b * (co-appearance distance)
where the latter is a Jaccard distance metric
Each of these components represents a choice the advertiser made when creating the messaging for an ad. Now that we have a variety of ads broken down into components, we can ask: which components are associated with ads that perform well or not so well?
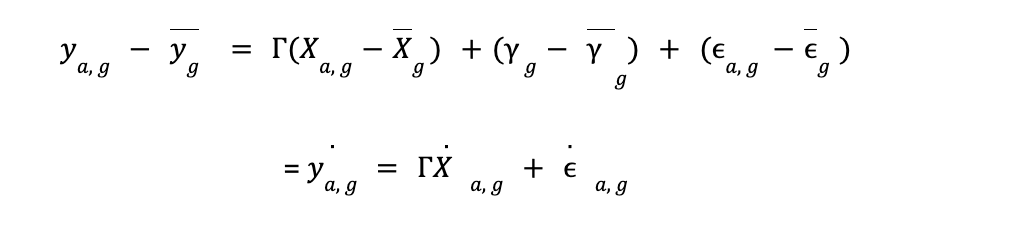
We use a fixed effects1 model to control for unobserved differences in the context in which different ads were served. This is because the features we are measuring are observed multiple times in different contexts i.e. ad copy, audience groups, time of year & device in which ad is served.
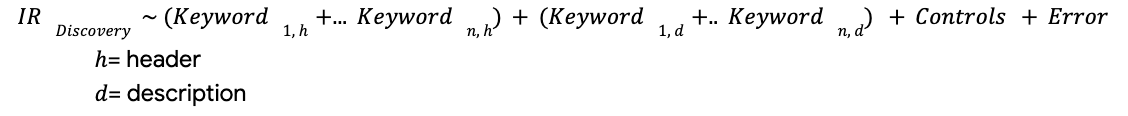
The trained model will seek to estimate the impact of individual keywords, phrases & image components in the discovery ad copies. The model form estimates Interaction Rate (denoted as ‘IR’ in the following formulas) as a function of individual ad copy features + controls:

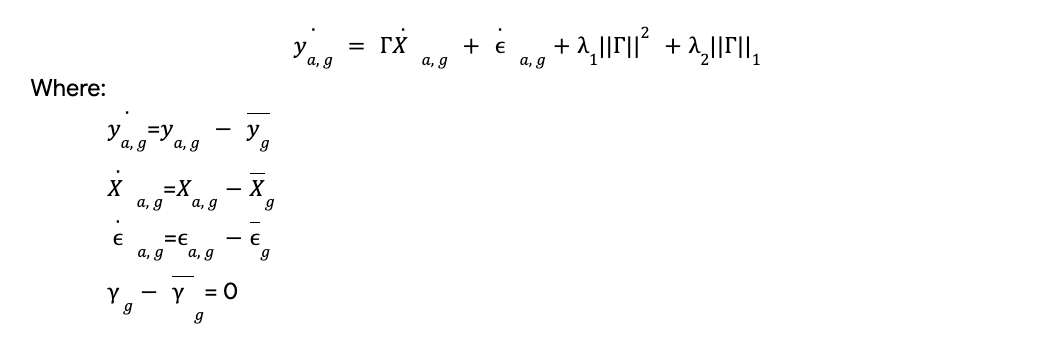
We use ElasticNet to spread the effect of features in presence of multicollinearity & improve the explanatory power of the model:
“Machine Learning model estimates the impact of individual keywords, phrases, and image components in discovery ad copies.”
– Manisha Arora, Data Scientist
Outputs & Insights
Outputs from the machine learning model help us determine the significant features. Coefficient of each feature represents the percentage point effect on CTR.
In other words, if the mean CTR without feature is X% and the feature ‘xx’ has a coeff of Y, then the mean CTR with feature ‘xx’ included will be (X + Y)%. This can help us determine the expected CTR if the most important features are included as part of the ad copies.
Key-takeaways (sample insights):We analyze keywords & imagery tied to the unique value propositions of the product being advertised. There are 6 key value propositions we study in the model. Following are the sample insights we have received from the analyses:

Shortcomings:
1. The current model does not consider groups of keywords that might be driving ad performance instead of individual keywords (Example – “Buy Now” phrase instead of “Buy” and “Now” individual keywords).
2. Inference and predictions are based on historical data and aren’t necessarily an indication of future success.
3. Insights are based on industry insights and may need to be tailored for a given advertiser.
DisCat breaks down exactly which features are working well for the ad and which ones have scope for improvement. These insights can help us identify high-impact keywords in the ads which can then be used to improve ad quality, thus improving business outcomes. As next steps, we recommend testing out the new ad copies with experiments to provide a more robust analysis. Google Ads A/B testing feature also allows you to create and run experiments to test these insights in your own campaigns.
Summary
Discovery Ads are a great way for advertisers to extend their social outreach to millions of people across the globe. DisCat helps break down discovery ads by analyzing text and images separately and using advanced ML/AI techniques to identify key aspects of the ad that drives greater performance. These insights help advertisers identify room for growth, identify high-impact keywords, and design better creatives that drive business outcomes.
Acknowledgement
Thank you to Shoresh Shafei and Jade Zhang for their contributions. Special mention to Nikhil Madan for facilitating the publishing of this blog.
Notes
[ad_2]
Source link